The 50-SMA is a super popular trading indicator for quantitative trading analysis. With the ongoing maturation of the general crypto market and the explosion of crypto trading bots, I thought it would be a great time to share how simple it is to calculate the SMA for yourself.
Using this article, you can easily plug the indicator into your trading bot. I’ll be using Python 3, Python Panda’s, and data from Binance. Links to these resources can be found at the bottom of the article.
Sign up for The Disruption Continuum
What would it take for Crypto, AI, and Cyber to truly change the world?
No spam. Unsubscribe anytime.
What is an SMA?
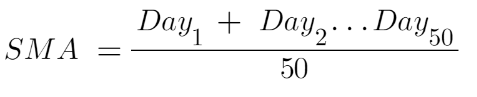
SMA is the acronym for a ‘Simple Moving Average’. It is the average price over a determined number of periods. The indicator is often used by traders to help predict trends in the market, with 50-day, 100-day, and 200-day indicators being the most common.
There are a number of common usages for an SMA, some of which I’ll cover in future episodes. For instance, an SMA cross can be used to indicate a market upturn or downturn.
Being able to plug these into your trading bot means that you can easily come up with more complex trading algorithms.
What You’ll Need
Python 3
Python Panda’s
(useful) An IDE. I use Jetbrains Pycharm, link at the bottom
How To Do It
Retrieve Data from Binance
Retrieving data from Binance is relatively straightforward. Here’s how:
Import the official Binance Python Connector from binance.spot import Spot()
Add the following function:
# Function to query Binance for candlestick data
def get_candlestick_data(symbol, timeframe, qty):
    # Retrieve the raw data
    raw_data = Spot().klines(symbol=symbol, interval=timeframe, limit=qty)
    # Set up the return array
    converted_data = []
    # Convert each element into a Python dictionary object, then add to converted_data
    for candle in raw_data:
        # Dictionary object
        converted_candle = {
            'time': candle[0],
            'open': float(candle[1]),
            'high': float(candle[2]),
            'low': float(candle[3]),
            'close': float(candle[4]),
            'volume': float(candle[5]),
            'close_time': candle[6],
            'quote_asset_volume': float(candle[7]),
            'number_of_trades': int(candle[8]),
            'taker_buy_base_asset_volume': float(candle[9]),
            'taker_buy_quote_asset_volume': float(candle[10])
        }
        # Add to converted_data
        converted_data.append(converted_candle)
    # Return converted data
    return converted_data
Create an SMA Calculator
The SMA calculator takes a given symbol, timeframe, and sma_size and returns a dataframe with all the SMA values added. This is incredibly simple with Pandas as we use the rolling function to group together the required number of observations.
Here are the steps the function walks through:
Retrieve raw_data using get_candlestick_data (I’ve assumed the maximum of 1000 rows for this)
Convert raw_data into a dataframe
‘Roll’ through the dataframe and calculate the mean
Here is the code for the function:
# Function to calculate a generic SMA
def calc_sma(symbol, timeframe, sma):
    # Get the raw data
    raw_data = get_candlestick_data(symbol=symbol, timeframe=timeframe, qty=1000)
    # Convert into dataframe
    df_data = pandas.DataFrame(raw_data)
    # Create name for new column
    name = "SMA_" + str(sma)
    # Roll through the dataframe to get the SMA
    df_data[name] = df_data['close'].rolling(sma).mean()
    return df_data
How to use
Now, in order to calculate the 50-day SMA, all you need to do is pass the values of the symbol=<your symbol>, timeframe="1d", and sma=50 and you’ll be all set.
Full Code
import pandas
from binance.spot import Spot


# Function to calculate a generic SMA
def calc_sma(symbol, timeframe, sma):
    # Get the raw data
    raw_data = get_candlestick_data(symbol=symbol, timeframe=timeframe, qty=1000)
    # Convert into dataframe
    df_data = pandas.DataFrame(raw_data)
    # Create name for new column
    name = "SMA_" + str(sma)
    # Roll through the dataframe to get the SMA
    df_data[name] = df_data['close'].rolling(sma).mean()
    return df_data


# Function to query Binance for candlestick data
def get_candlestick_data(symbol, timeframe, qty):
    # Retrieve the raw data
    raw_data = Spot().klines(symbol=symbol, interval=timeframe, limit=qty)
    # Set up the return array
    converted_data = []
    # Convert each element into a Python dictionary object, then add to converted_data
    for candle in raw_data:
        # Dictionary object
        converted_candle = {
            'time': candle[0],
            'open': float(candle[1]),
            'high': float(candle[2]),
            'low': float(candle[3]),
            'close': float(candle[4]),
            'volume': float(candle[5]),
            'close_time': candle[6],
            'quote_asset_volume': float(candle[7]),
            'number_of_trades': int(candle[8]),
            'taker_buy_base_asset_volume': float(candle[9]),
            'taker_buy_quote_asset_volume': float(candle[10])
        }
        # Add to converted_data
        converted_data.append(converted_candle)
    # Return converted data
    return converted_data
Say Hi!
I love hearing from my readers, so feel free to reach out. It means a ton to me when you clap for my articles or drop a friendly comment — it helps me know that my content is helping.