The Relative Strength Index (RSI) is a popular indicator used by traders to identify overbought or oversold conditions. This great little technical indicator can be used across almost any financial market, including securities, stocks, cryptocurrency, forex, and futures.
In this article, I’ll be diving deeper into this powerful indicator to explore how it can be used to level up your trading strategies.
Sign up for The Disruption Continuum
What would it take for Crypto, AI, and Cyber to truly change the world?
No spam. Unsubscribe anytime.
What Is the Relative Strength Index?
The RSI measures recent price changes by oscillating between 0–100. As a technical indicator, it is classified as a Momentum Indicator, meaning that traders use it to determine the pricing momentum of a given financial instrument.
The RSI charts the relative price movements of a financial instrument, using a normalized scale of 0–100. The normalization process of the RSI means that the RSI levels used in technical analysis are consistent. No matter what financial instrument the RSI is applied to, it will always provide an oscillation between 0–100. The result is a momentum oscillator frequently used in technical trading systems to identify bullish and bearish price movements.
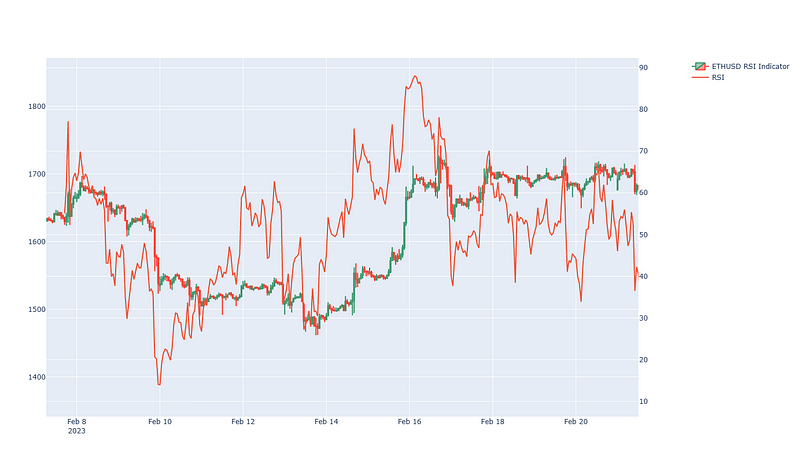
For example, here is the RSI applied against the ETHUSD cryptocurrency pair. It can be seen that the oscillation occurs between 0–100, despite the price ranging between $1700 USD and $1450 USD.
Relative Strength Index plotted for the Ethereum Crypto Currency against the USD (ETH/USD) currency
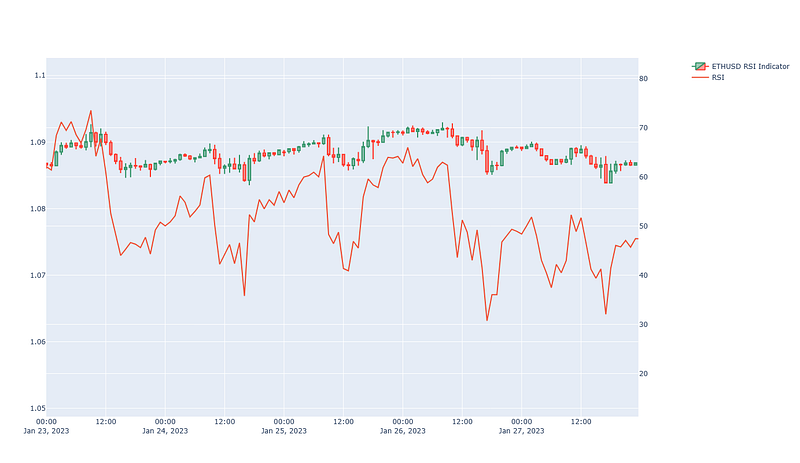
The same oscillation can then be observed on the FOREX EURUSD currency pair. The oscillation continues to range between 0–100, even though the EUR/USD price chart moves between $1.08 USD and $1.09 USD.
Relative Strength Index (RSI) plotted for the EUR/USD currency pair.
RSI Calculation
The RSI calculation is performed in two parts.
Part 1 uses an average gain/loss calculation to establish the movement of a security. Part 2 uses the period of the RSI calculation to smooth the values between 0–100, providing the RSI values.
Check out this article if you’d like a more detailed walkthrough.
What’s the Difference between the RSI and MACD?
Two technical indicators that are often used together are the Moving Average Convergence/Divergence (MACD) and the RSI. However, they are distinctly different, providing indications of a securities price momentum.
The MACD provides insight into the overall momentum of a securities price chart. It is often used to identify price reversals, with the MACD histogram providing an indication as to the strength of the pricing direction. While it is a momentum oscillator, the values oscillate between positive and negative values, and there are no fixed overbought readings or oversold conditions. It is most effective in fast-moving markets, and least effective in sideways markets. Read more about it here, or learn how to integrate it into your Python Trading Bot.
MACD explanation in video format
In contrast, the RSI indicator oscillates between 0–100, with fixed levels indicating overbought or oversold levels. The RSI is the least effective when price movements are fast.
How to use the RSI indicator?
The RSI indicator is primarily used to identify overbought and oversold conditions. Here’s how to use it to do so.
Identifying Overbought and Oversold Securities
Many traders use a series of RSI values to determine when securities are overbought, oversold, or neutral. While every security may have specific values which are most relevant, frequently identified through backtesting, the common starting points for RSI readings are:
An RSI reading of 70 or more indicates that a security is overbought, indicating a bearish price momentum movement may soon occur
An RSI reading of 30 or below indicates that a security is oversold, indicating a bullish price momentum movement may soon occur
An RSI value of 50 indicates that a security is neutral
Identifying Uptrends and Downtrends
A second use of the RSI indicator is the identification of trend signals. This is done by visually identifying the momentum swings of the RSI oscillation, the identifying high’s and lows of the oscillation itself.
Note that many advanced traders believe that the RSI is not as effective in identifying strong price trends or trend reversals, so this method should be used with caution.
RSI Bearish and Bullish Divergences
A third use of the RSI in technical analysis is through divergence. Divergence occurs when a security moves in the opposite direction from a technical indicator.
When an RSI chart is diverging from the security being measured, this can indicate a trend reversal, as follows:
Bearish divergence occurs when the securities price chart reaches higher highs, but the RSI chart reaches a lower high
Bullish divergence occurs when the securities price chart reaches lower lows, but the RSI chart reaches a higher low
Note that as with Uptrends and Downtrends, the RSI is not believed to be effective when markets are trending, so it should only be used during a ranging market.
How Can I Add the RSI to My MetaTrader Python Trading Bot?
A full explanation of how to add the RSI indicator to your Python Trading Bot will be covered in a future episode, however, here is a snippet of code to help you out:
# Part of Medium Article: "Relative Strength Index (RSI) Indicator Explained with Examples, Strategies, and a little bit of Code"
# Link to Article: https://medium.com/@appnologyjames/relative-strength-index-rsi-indicator-explained-with-examples-strategies-and-a-little-bit-of-d2973a74198a

# Function to calculate the RSI indicator
def calc_rsi(dataframe, rsi_size=14, display=False, symbol=None):
    """
    Function to calculate the RSI indicator. Default period is 14.
    :param dataframe: dataframe object of security to have RSI applied to
    :param rsi_size: size of the RSI oscillation. Default 14.
    :param display: boolean to determine whether the RSI indicator should be displayed
    :param symbol: string. Used for display
    :return: dataframe with RSI values included or figure
    """
    # Calculate the RSI values in the dataframe
    dataframe['rsi'] = talib.RSI(dataframe['close'], timeperiod=rsi_size)
    if display:
        title = symbol + " RSI Indicator"
        fig = display_lib.display_rsi_indicator(
            dataframe=dataframe,
            title=title
        )
        # Return the dataframe
        return fig
    else:
        # If not displaying, return the dataframe
        return dataframe
Make sure you import TA-Lib to get started
RSI Buy and Sell signals
Let’s explore how to identify buy signals and sell signals using the RSI indicator.
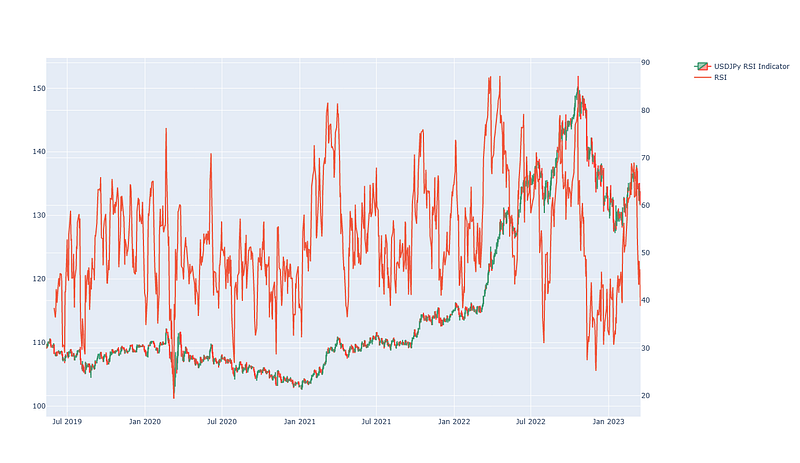
I’ll demonstrate using the following parameters, charted using the open-source Algorithmic Trading Bot:
Security. USDJPY FOREX pair
Timeframe. Daily Candle
Data Source. MetaTrader 5
Date Devleoped. 21 March 2023
Full Plot
RSI for the USD/JPY currency pair using live data from MetaTrader
Identifying overbought and oversold conditions
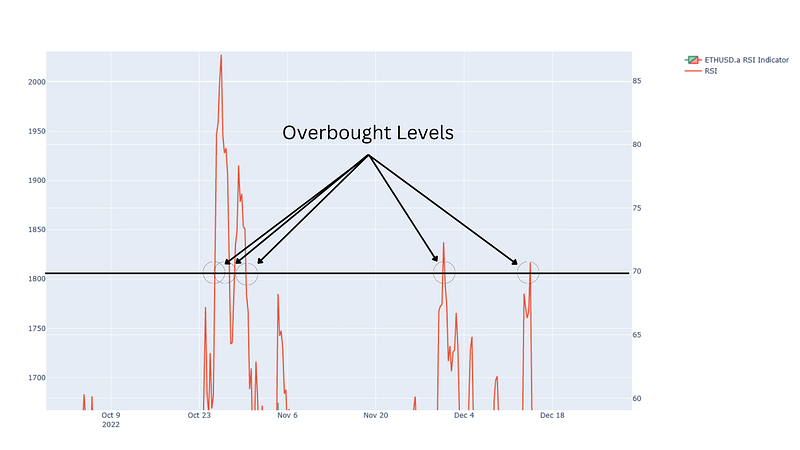
In classic RSI theory, an asset is considered overbought when the RSI chart crosses above the 70 level. Visually, zooming in on the ETHUSD currency pair used earlier, this is what an overbought reading looks like:
Visual display of overbought levels for the RSI technical indicator
Any reading above 70 can be considered to be in overbought territory.
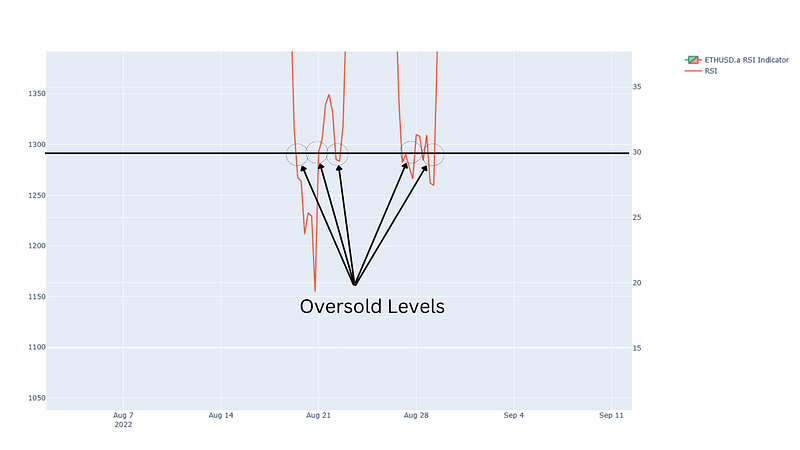
An asset is considered oversold when the RSI chart crosses below the 30 level, entering into oversold territory. Here is what this looks like:
Visual display of oversold RSI levels, using oversold level of 30
As with other technical indicators, the levels should only be considered a guide. Each securities technical analysis is likely to have it’s own specific levels.
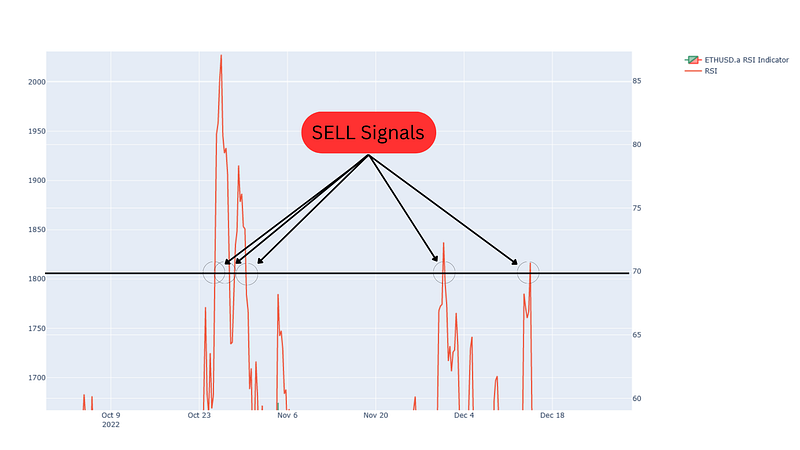
RSI SELL Signals
Converting the RSI Overbought readings into SELL signals, based upon overbought RSI levels of 70, the following chart can be seen:
Sell levels for the RSI Signal
RSI BUY Signals
Converting the RSI Oversold readings into BUY signals, a FOREX trader would determine the following BUY Signals based upon oversold RSI levels of 30:
RSI Indicator Trading Strategies
One of the most common RSI Indicator trading strategies is using the levels of 70 and 30 to indicate BUY and SELL points. In this strategy, a trader BUYs the asset when a level below 30 is entered, then SELLs the asset when the level reaches 70.
This strategy is particularly well suited for backtesting optimization as the BUY and SELL levels can be different for each asset.
If you’d like to see how to implement this strategy into your MetaTrader 5 Python Trading Bot, check out the links below (updated as content becomes available).
RSI AutoTrade Strategy for Your MetaTrader 5 Python Trading Bot (Medium)
AutoTrade the RSI Technical Indicator with your MetaTrader Python Trading Bot (YouTube)
Backtest Results
Weaknesses of the RSI Technical Indicator
The RSI indicator is least effective during sustained trend lines. During sustained periods of price growth or price decline, the RSI will remain at high (> 70) or low (< 30) levels for extended periods of time, reducing its efficacy to identify entry and exit points.
The RSI can also be overly sensitive to small price movements, leading to false BUY and SELL signals
I love hearing from my readers, so feel free to reach out. It means a ton to me when you clap for my articles or drop a friendly comment — it helps me know that my content is helping.